Three connected tools.
One coherent infrastructure for community-engaged scholarship.
The CEnTR* System helps institutions discover engagement, represent it with integrity, and demonstrate its value in ways communities and institutions can trust. Each tool can stand alone. Together, they form a full workflow for making engagement visible, actionable, and sustainable.

The sequence is practical. The relationship is iterative.
SEEK surfaces engagement that is already happening but not yet visible. MAP documents what communities are contributing to that engagement and centering assets, not deficits. IMPACT demonstrates the value of what the work produces in terms that travel across institutional contexts.
The tools are designed to feed each other. SEEK's structured outputs become the starting point for MAP's asset documentation. MAP's representations of partnership quality inform what IMPACT is asked to measure. And IMPACT's evidence — of what works, where, and why — strengthens the case for the engagement that SEEK is still finding.

engagement records
engagement with integrity.
partnership data

CEnTR*SEEK
Make engagement visible.
In DevelopmentSEEK is the system's entry point. It ingests institutional text from multiple sources and processes it through a modular pipeline: preprocessing and named entity recognition, transformer-based embedding, and multi-dimensional classification across five dimensions: Partnership and Power, Community Voice, Process and Methods, Outcomes and Impacts, and Sustainability.
Every output includes not just a classification and confidence score but highlighted excerpts and plain-language rationales. The system is designed as an analytical partner that invites human review, not an opaque judge that produces verdicts.
- Structured engagement records with classification labels and confidence scores
- Named entities — faculty, partners, neighborhoods, organizations — anchored to the text
- Supporting excerpts that explain how each determination was made
- A dataset ready for import into CEnTR*MAP and CEnTR*IMPACT
SEEK's structured outputs — engagement records tagged by dimension, partner, and location — become the raw material that MAP organizes into an asset-based picture of what communities are contributing.
MAP organizes its capital taxonomy within a nested ecological systems model, situating assets from the deeply personal to the broadly historical. Familial and linguistic capital. Resistance capital and historical heritage. The full range of what Yosso's Community Cultural Wealth framework makes legible, structured so that what gets documented reflects the depth and diversity of community strength.
AI-assisted processing identifies references to community contributions across texts and maps them to the capital taxonomy, but never replaces human interpretation. The system surfaces connections and gaps while users maintain control over how their work and their partners are represented.
- Asset-tagged project records organized by capital type and ecological system level
- Structured datasets supporting flexible querying and visualization over time
- Deficit language flags — identifying where existing documentation frames communities in terms of need rather than strength
- Asset-centered narrative summaries for funders, accreditors, and leadership
CEnTR*MAP
Understand and represent engagement with integrity.
In DevelopmentMAP's asset-tagged records and partnership quality data give IMPACT the context it needs to measure not just what a project produced, but how equitably it was pursued and how deeply community priorities shaped the work.
CEnTR*IMPACT
Make value legible.
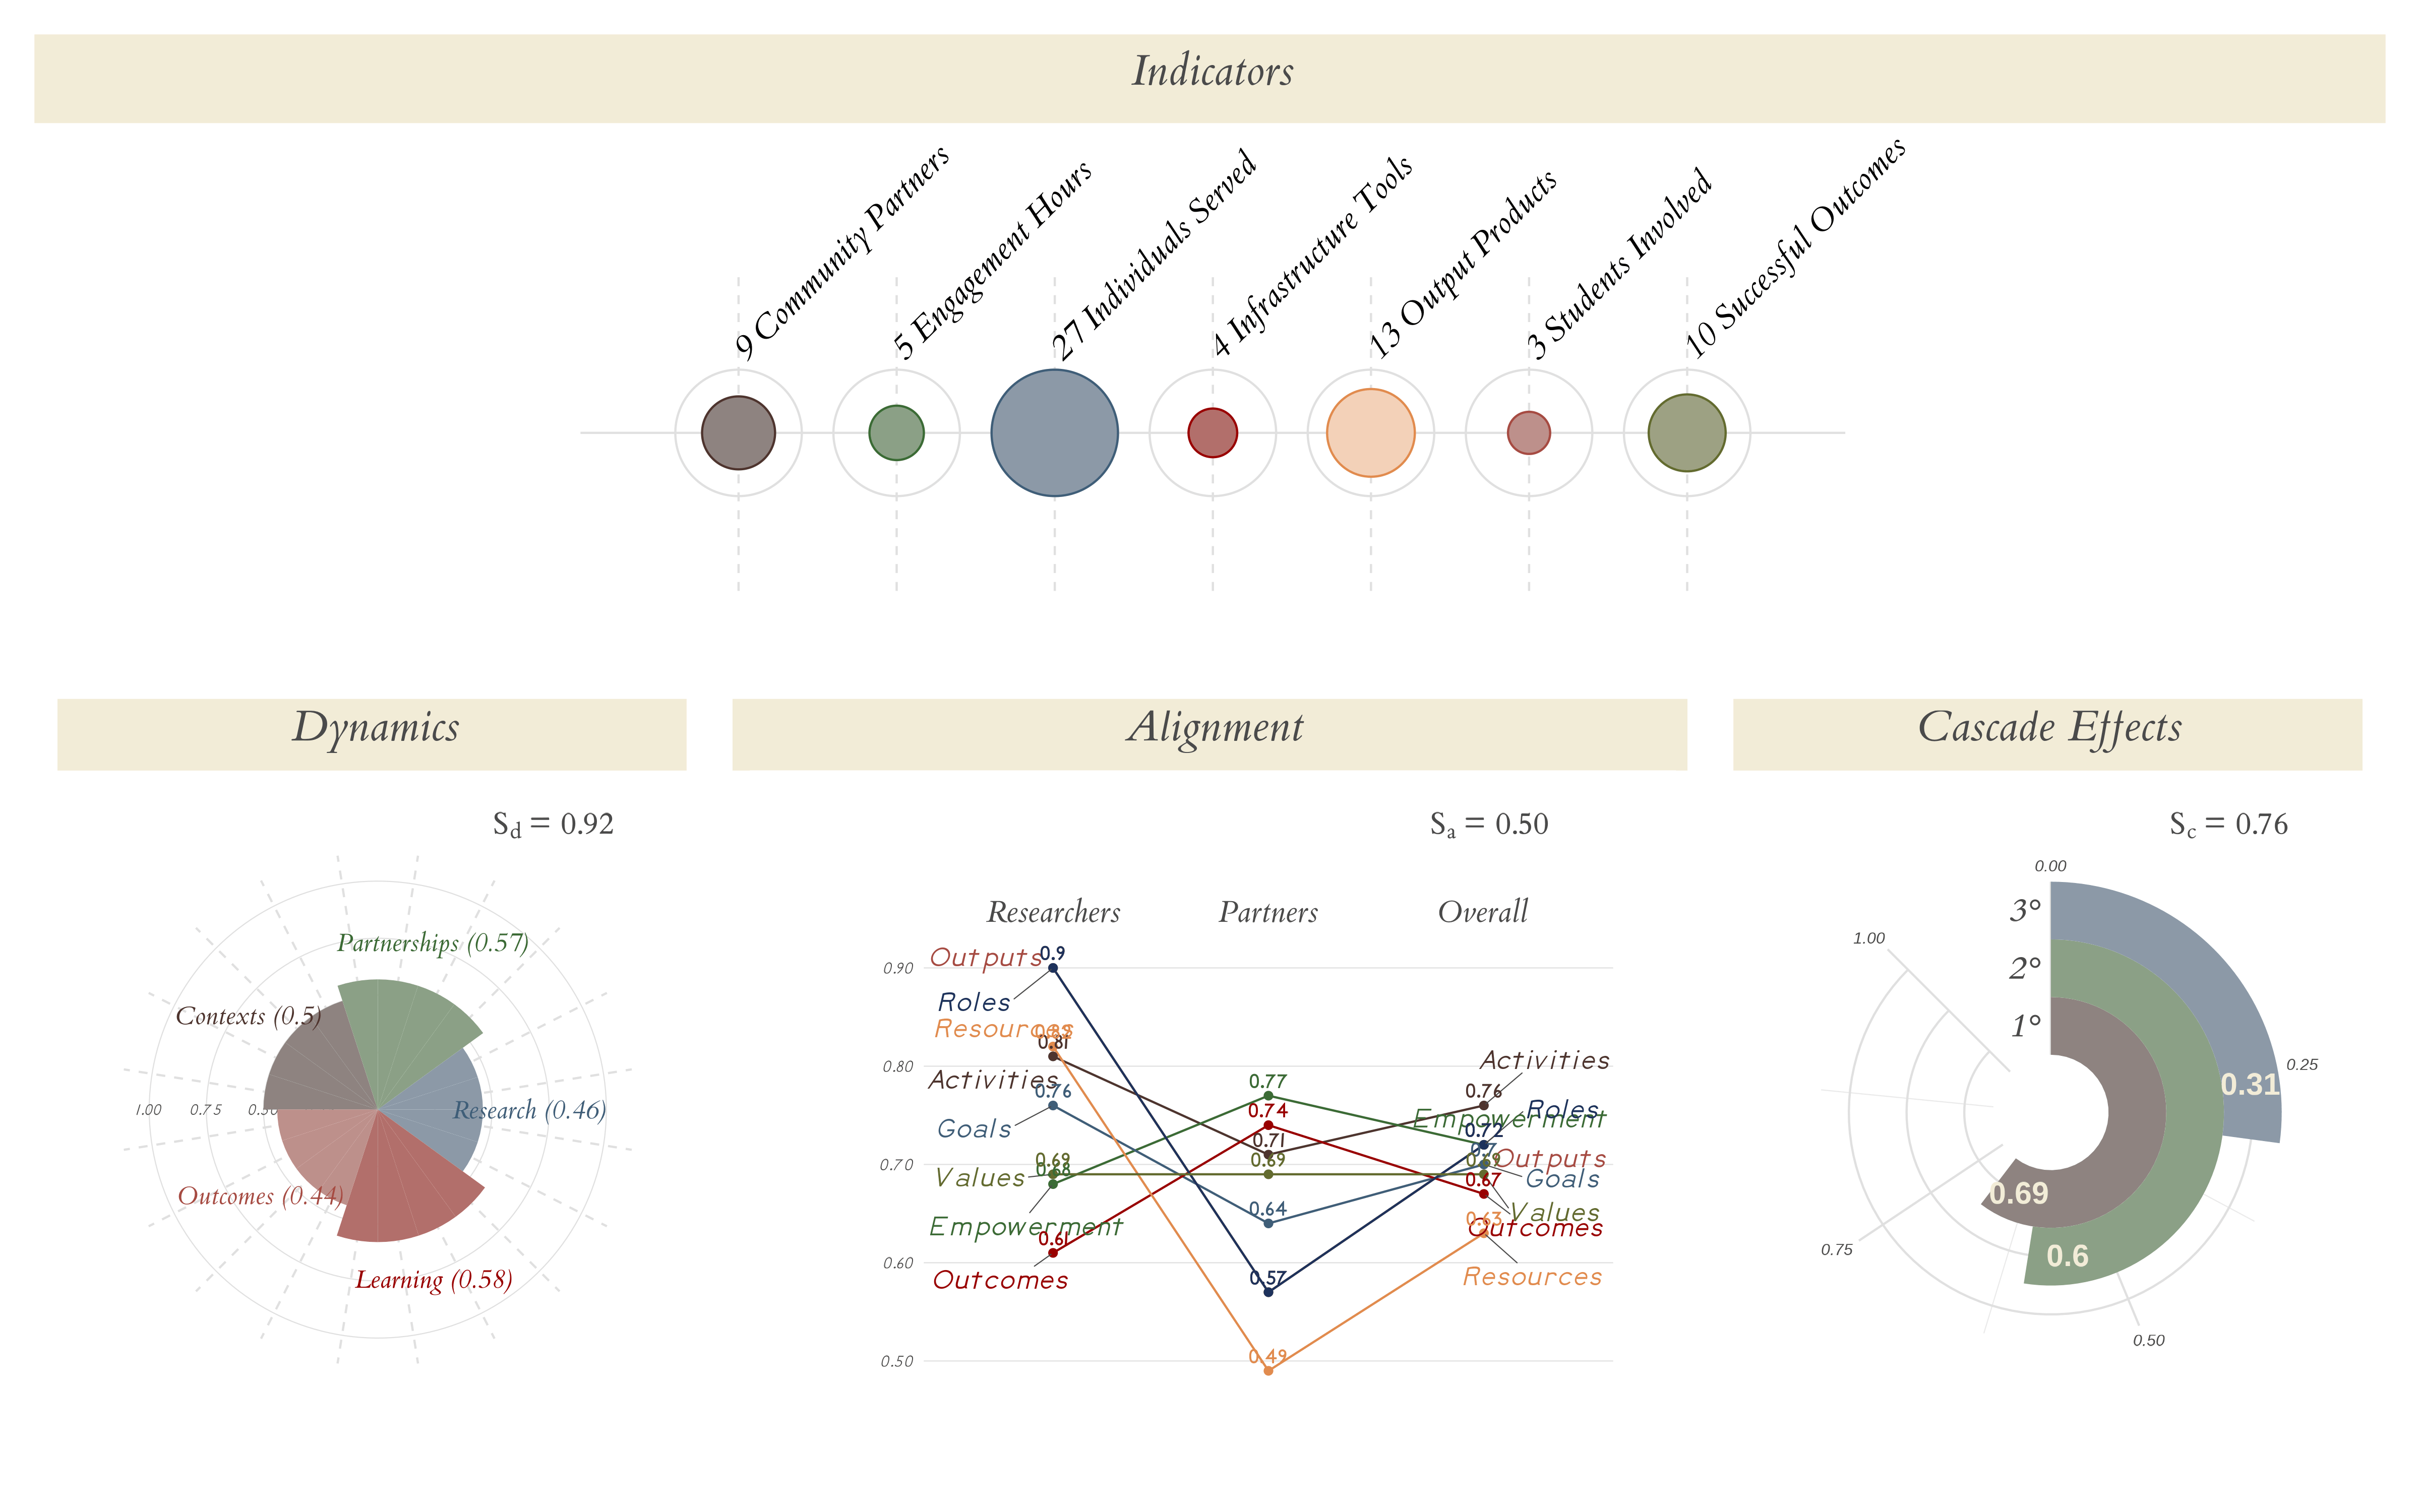
Actively UsedThe ensemble was developed through a rigorous participatory process with community-engaged scholars who identified the most salient dimensions of their work, giving CEnTR*IMPACT both face validity and expert validity. The metrics reflect what community-engaged scholars themselves say matters most.
The accompanying R package toolkit reads survey exports from Google Forms or Qualtrics, performs all calculations, and generates publication-quality visualizations and narrative-ready reports, making rigorous analysis accessible to any scholar regardless of statistical background. Visualizations draw on techniques pioneered by Florence Nightingale and W.E.B. DuBois.
Ready to apply the system in your context?
If your institution is ready to move from fragmented documentation to coherent infrastructure for community-engaged scholarship, we'd be glad to talk.
Book Time with Jeremy