The CEnTR* System

CEnTR*IMPACT

Community-engaged research produces real value: for communities, for institutions, for the public good. But existing evaluation systems were never designed to see it. Impact goes uncounted, contributions go uncredited, and the most important work remains invisible.

CEnTR*IMPACT changes that. Three integrated components profile community impact, translate engaged outputs into scholarly credit, and track how an institution's engagement deepens over time.

Botanical illustration of common milkweed

Like milkweed spreading silk-tufted seeds on the wind, intentional metrics help gather community members together and facilitate the distribution of information and power.

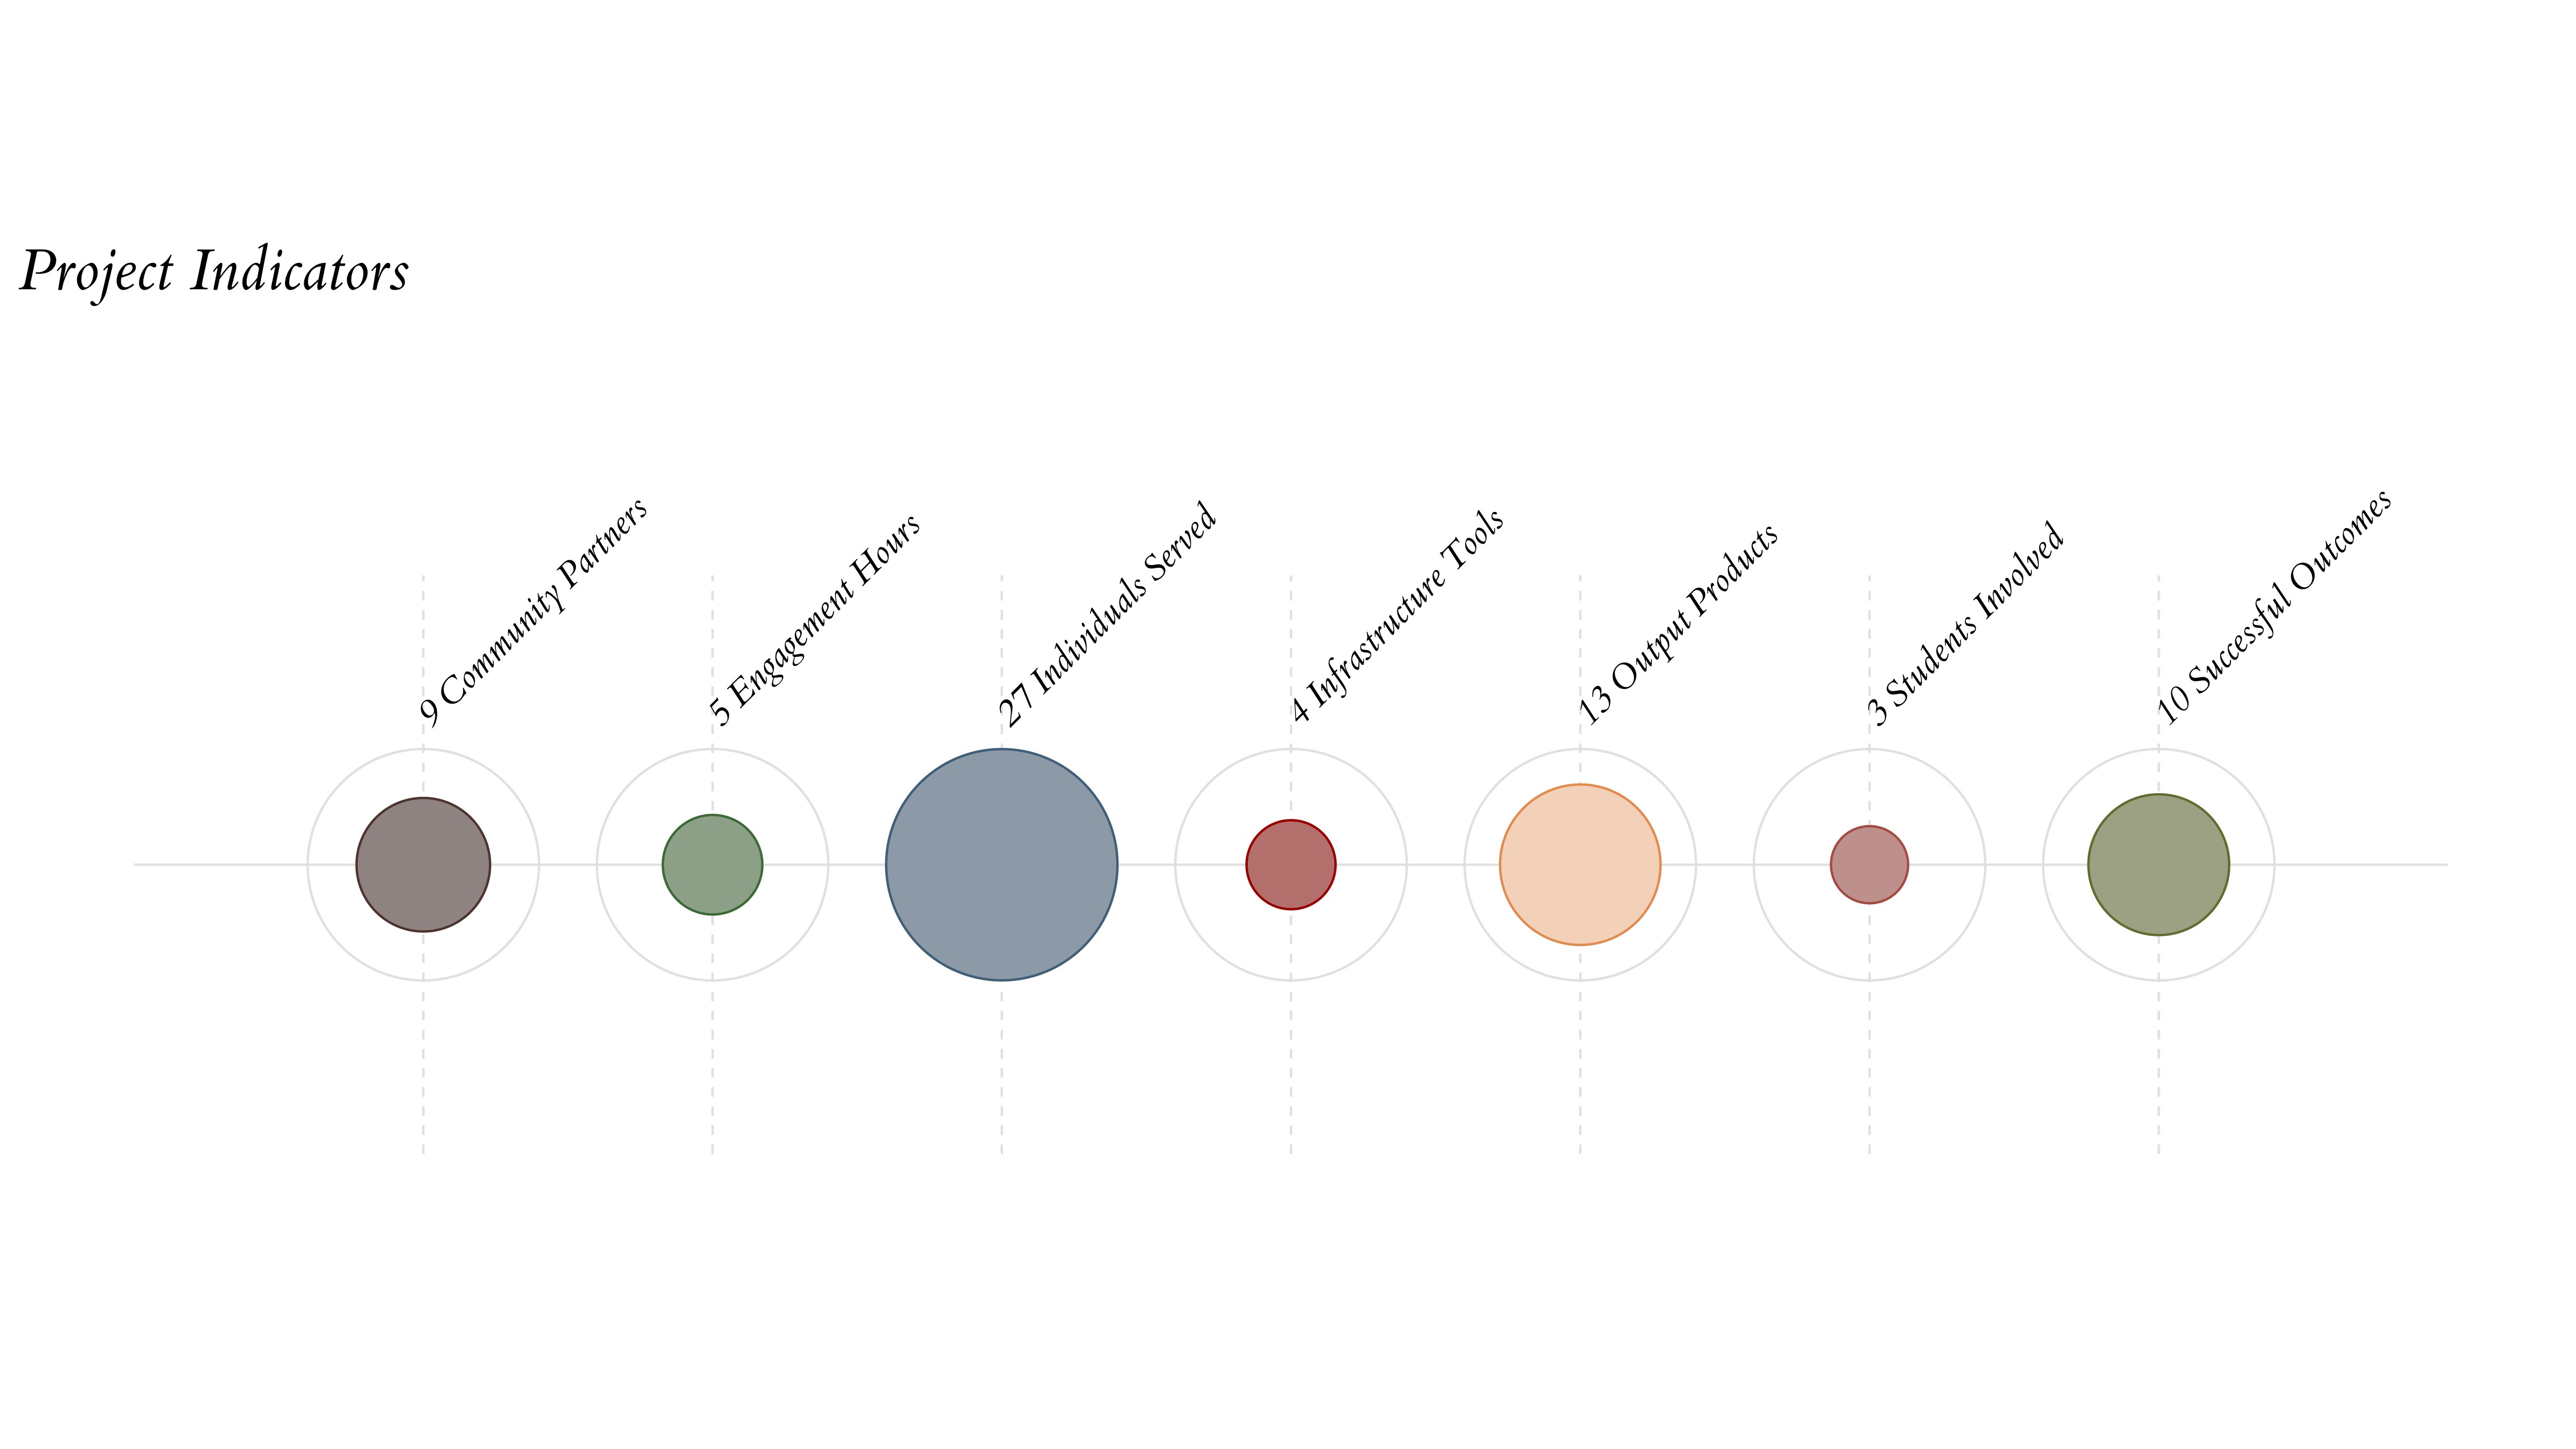
The question isn't whether community-engaged research has value. The question is whether our measurement systems can see it.

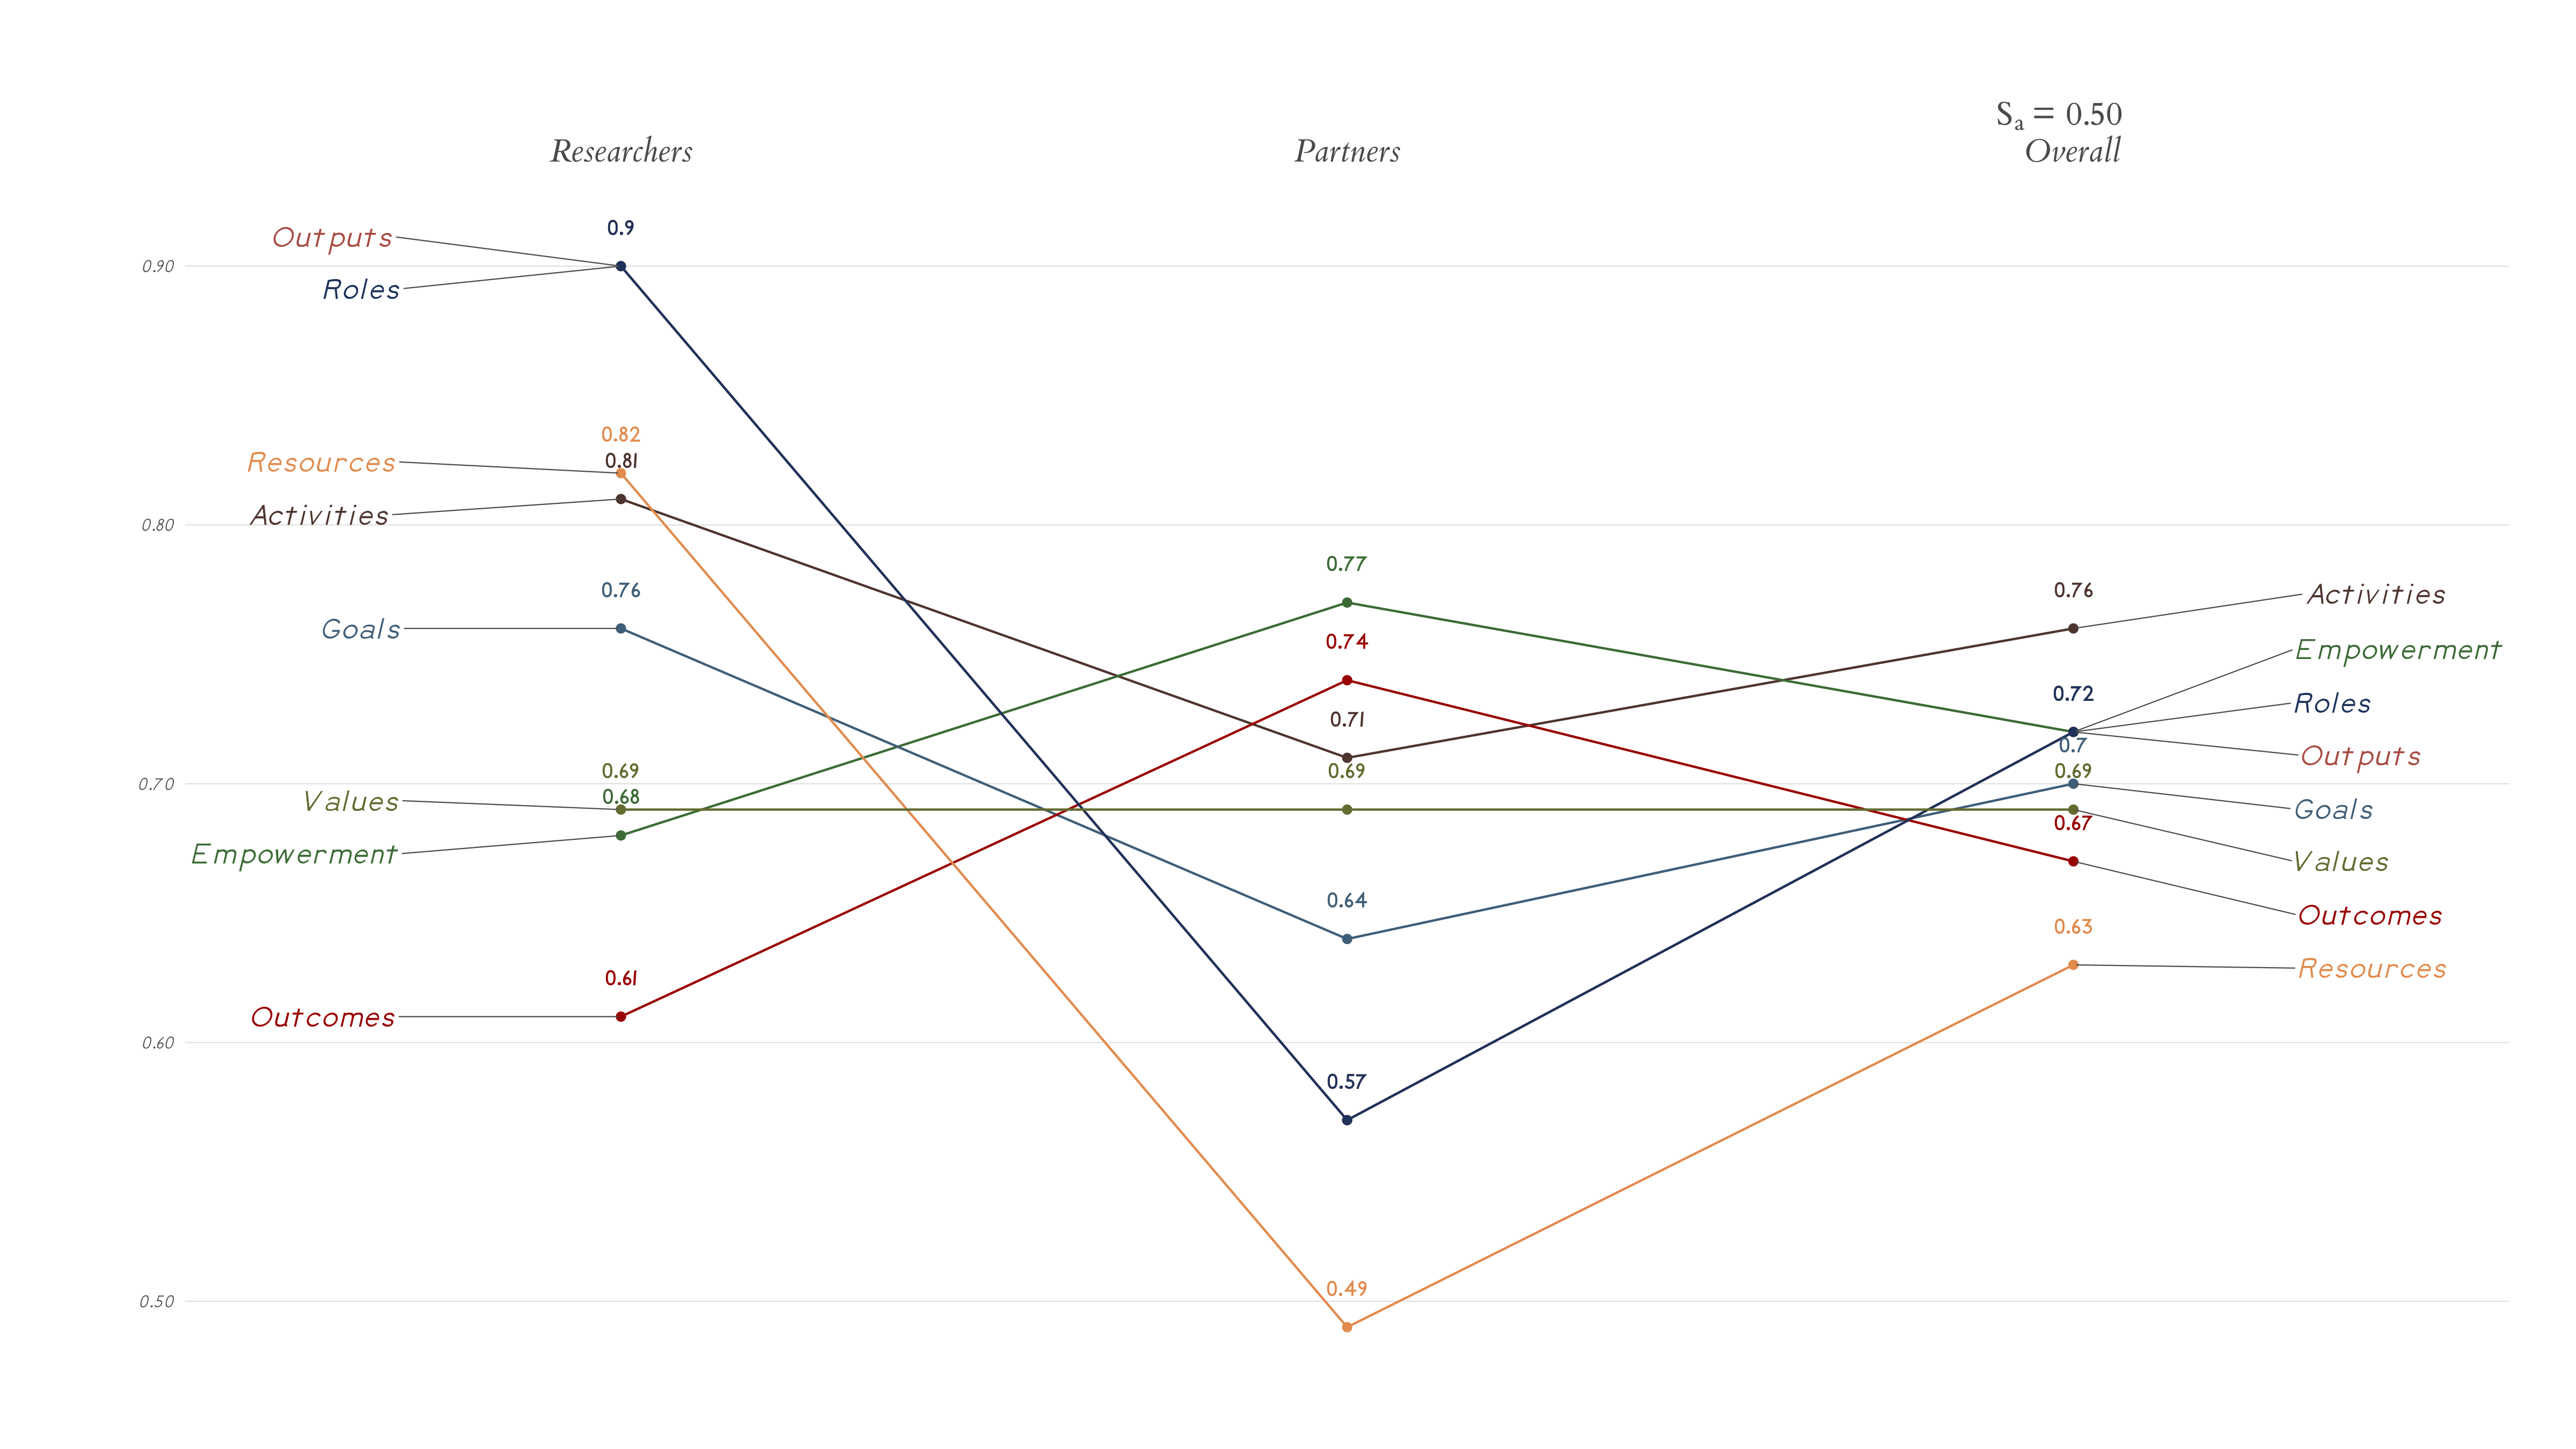
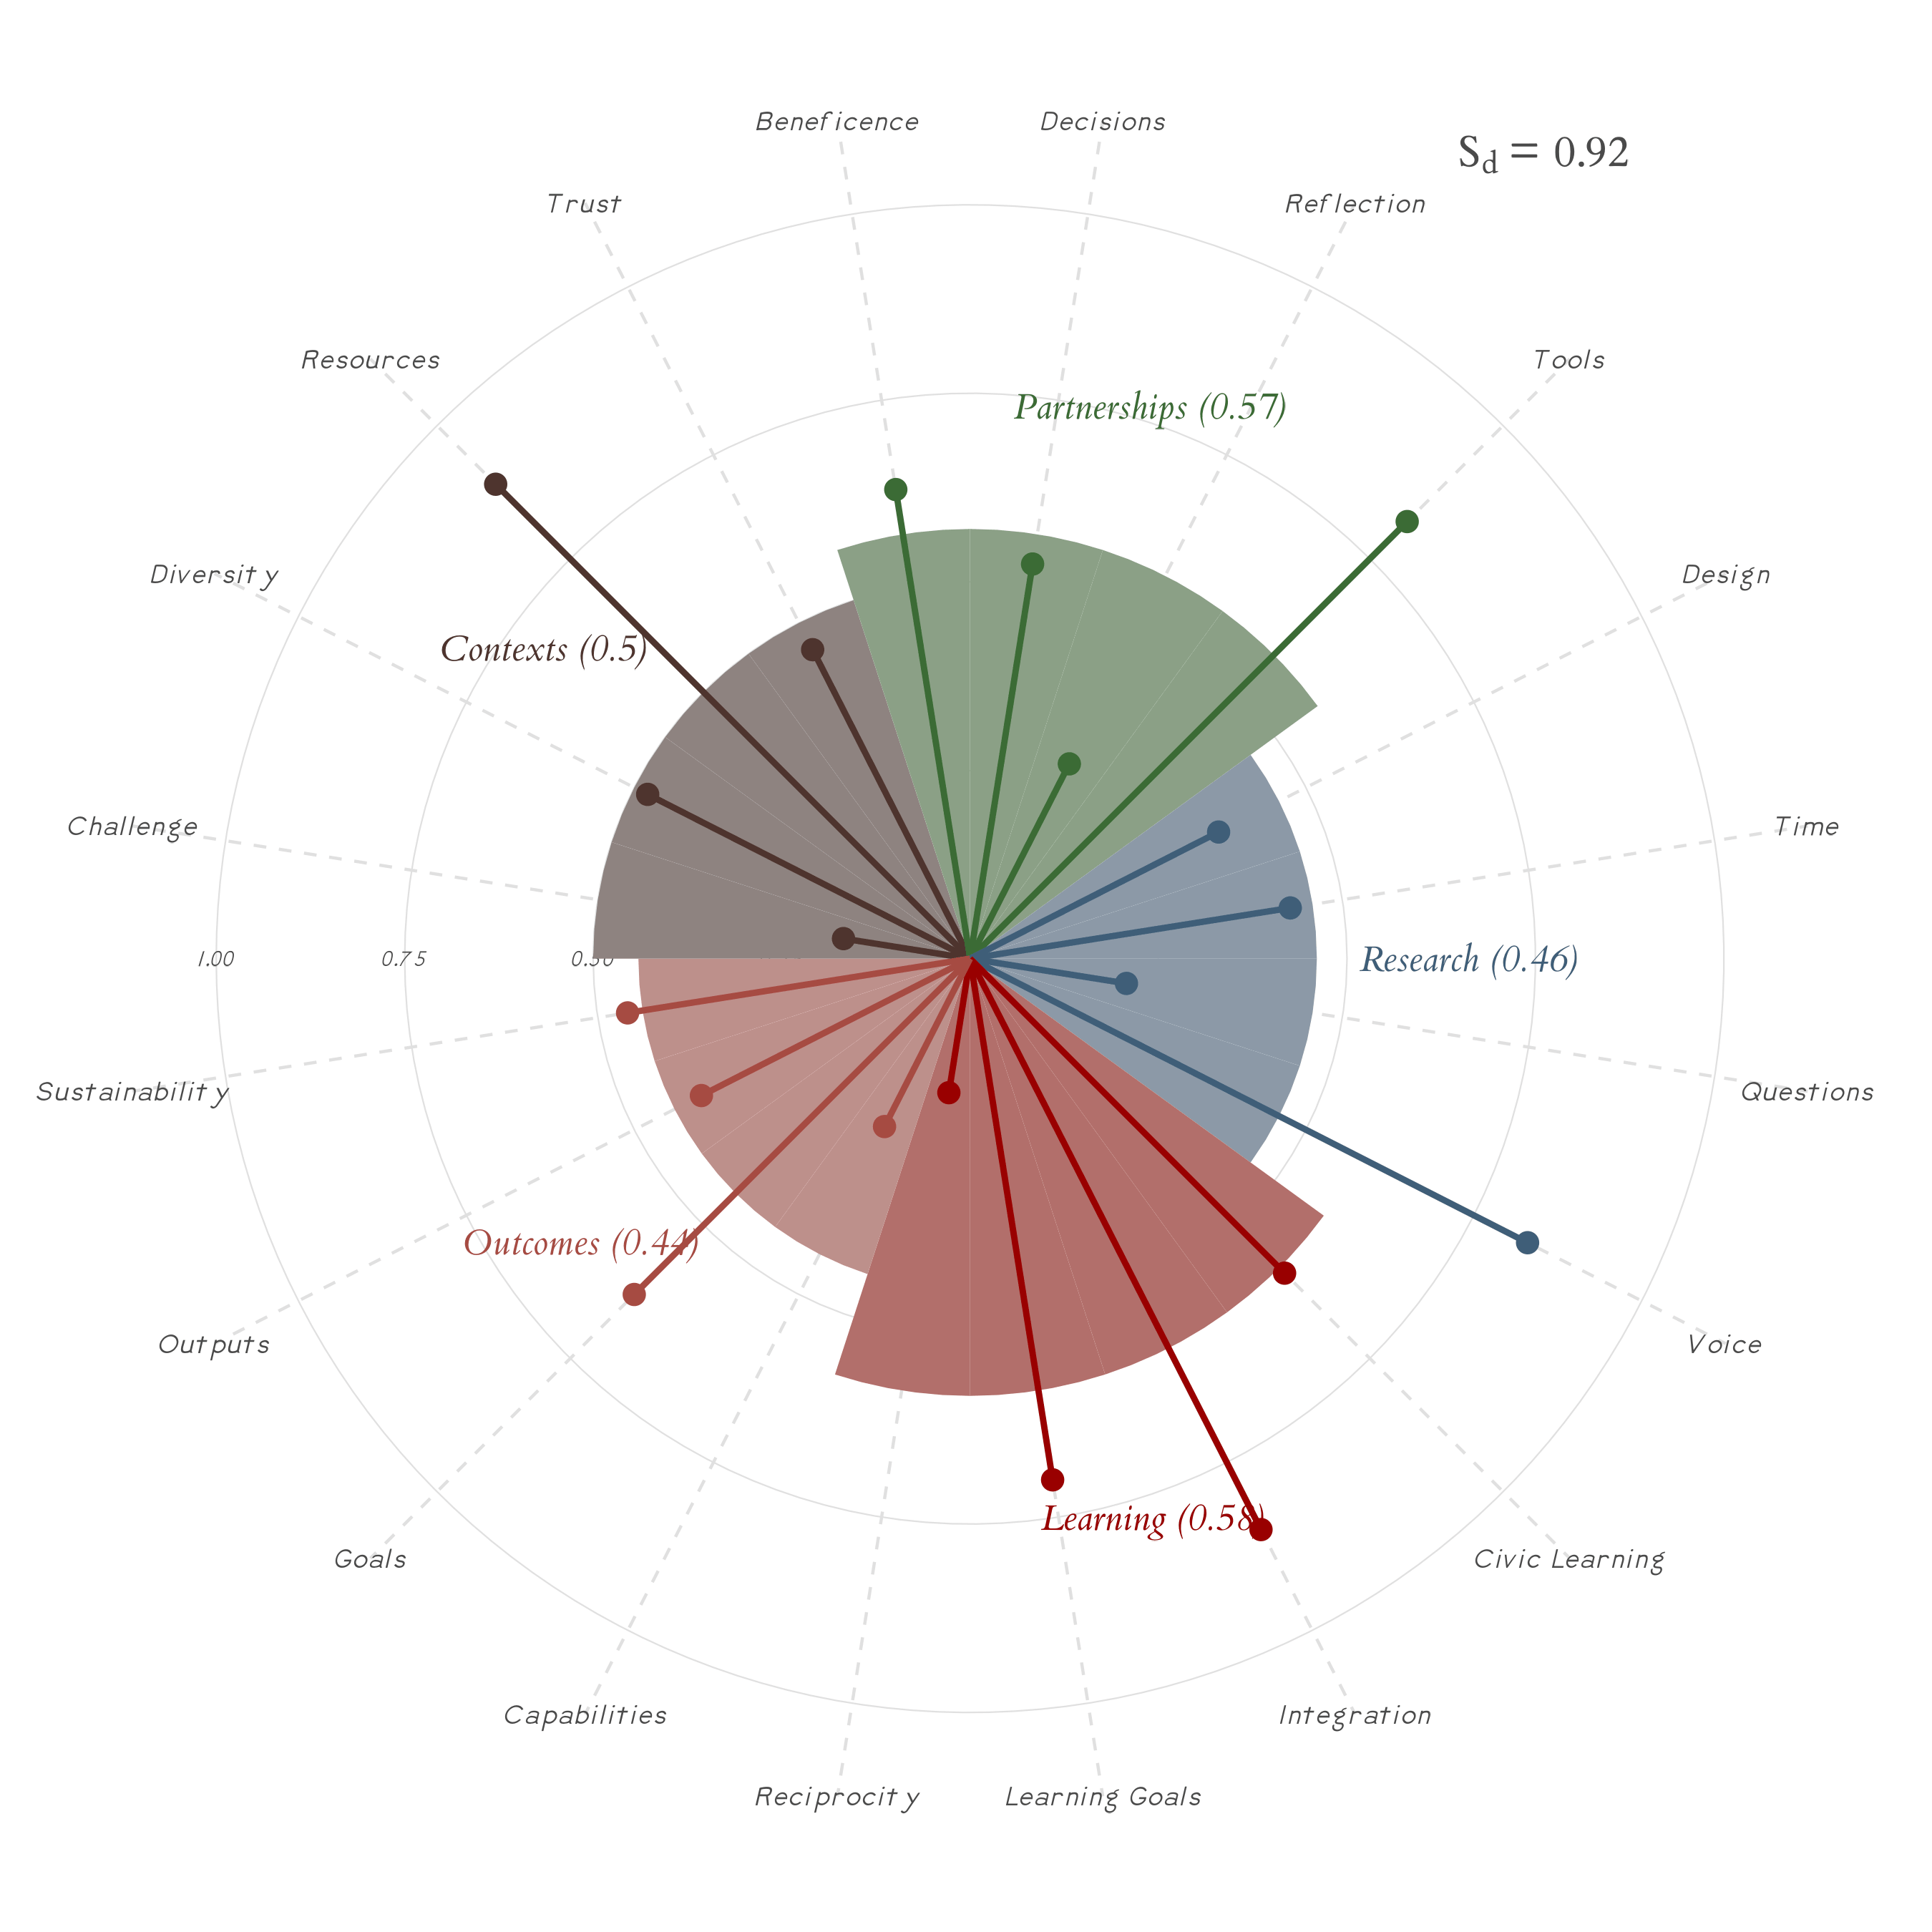
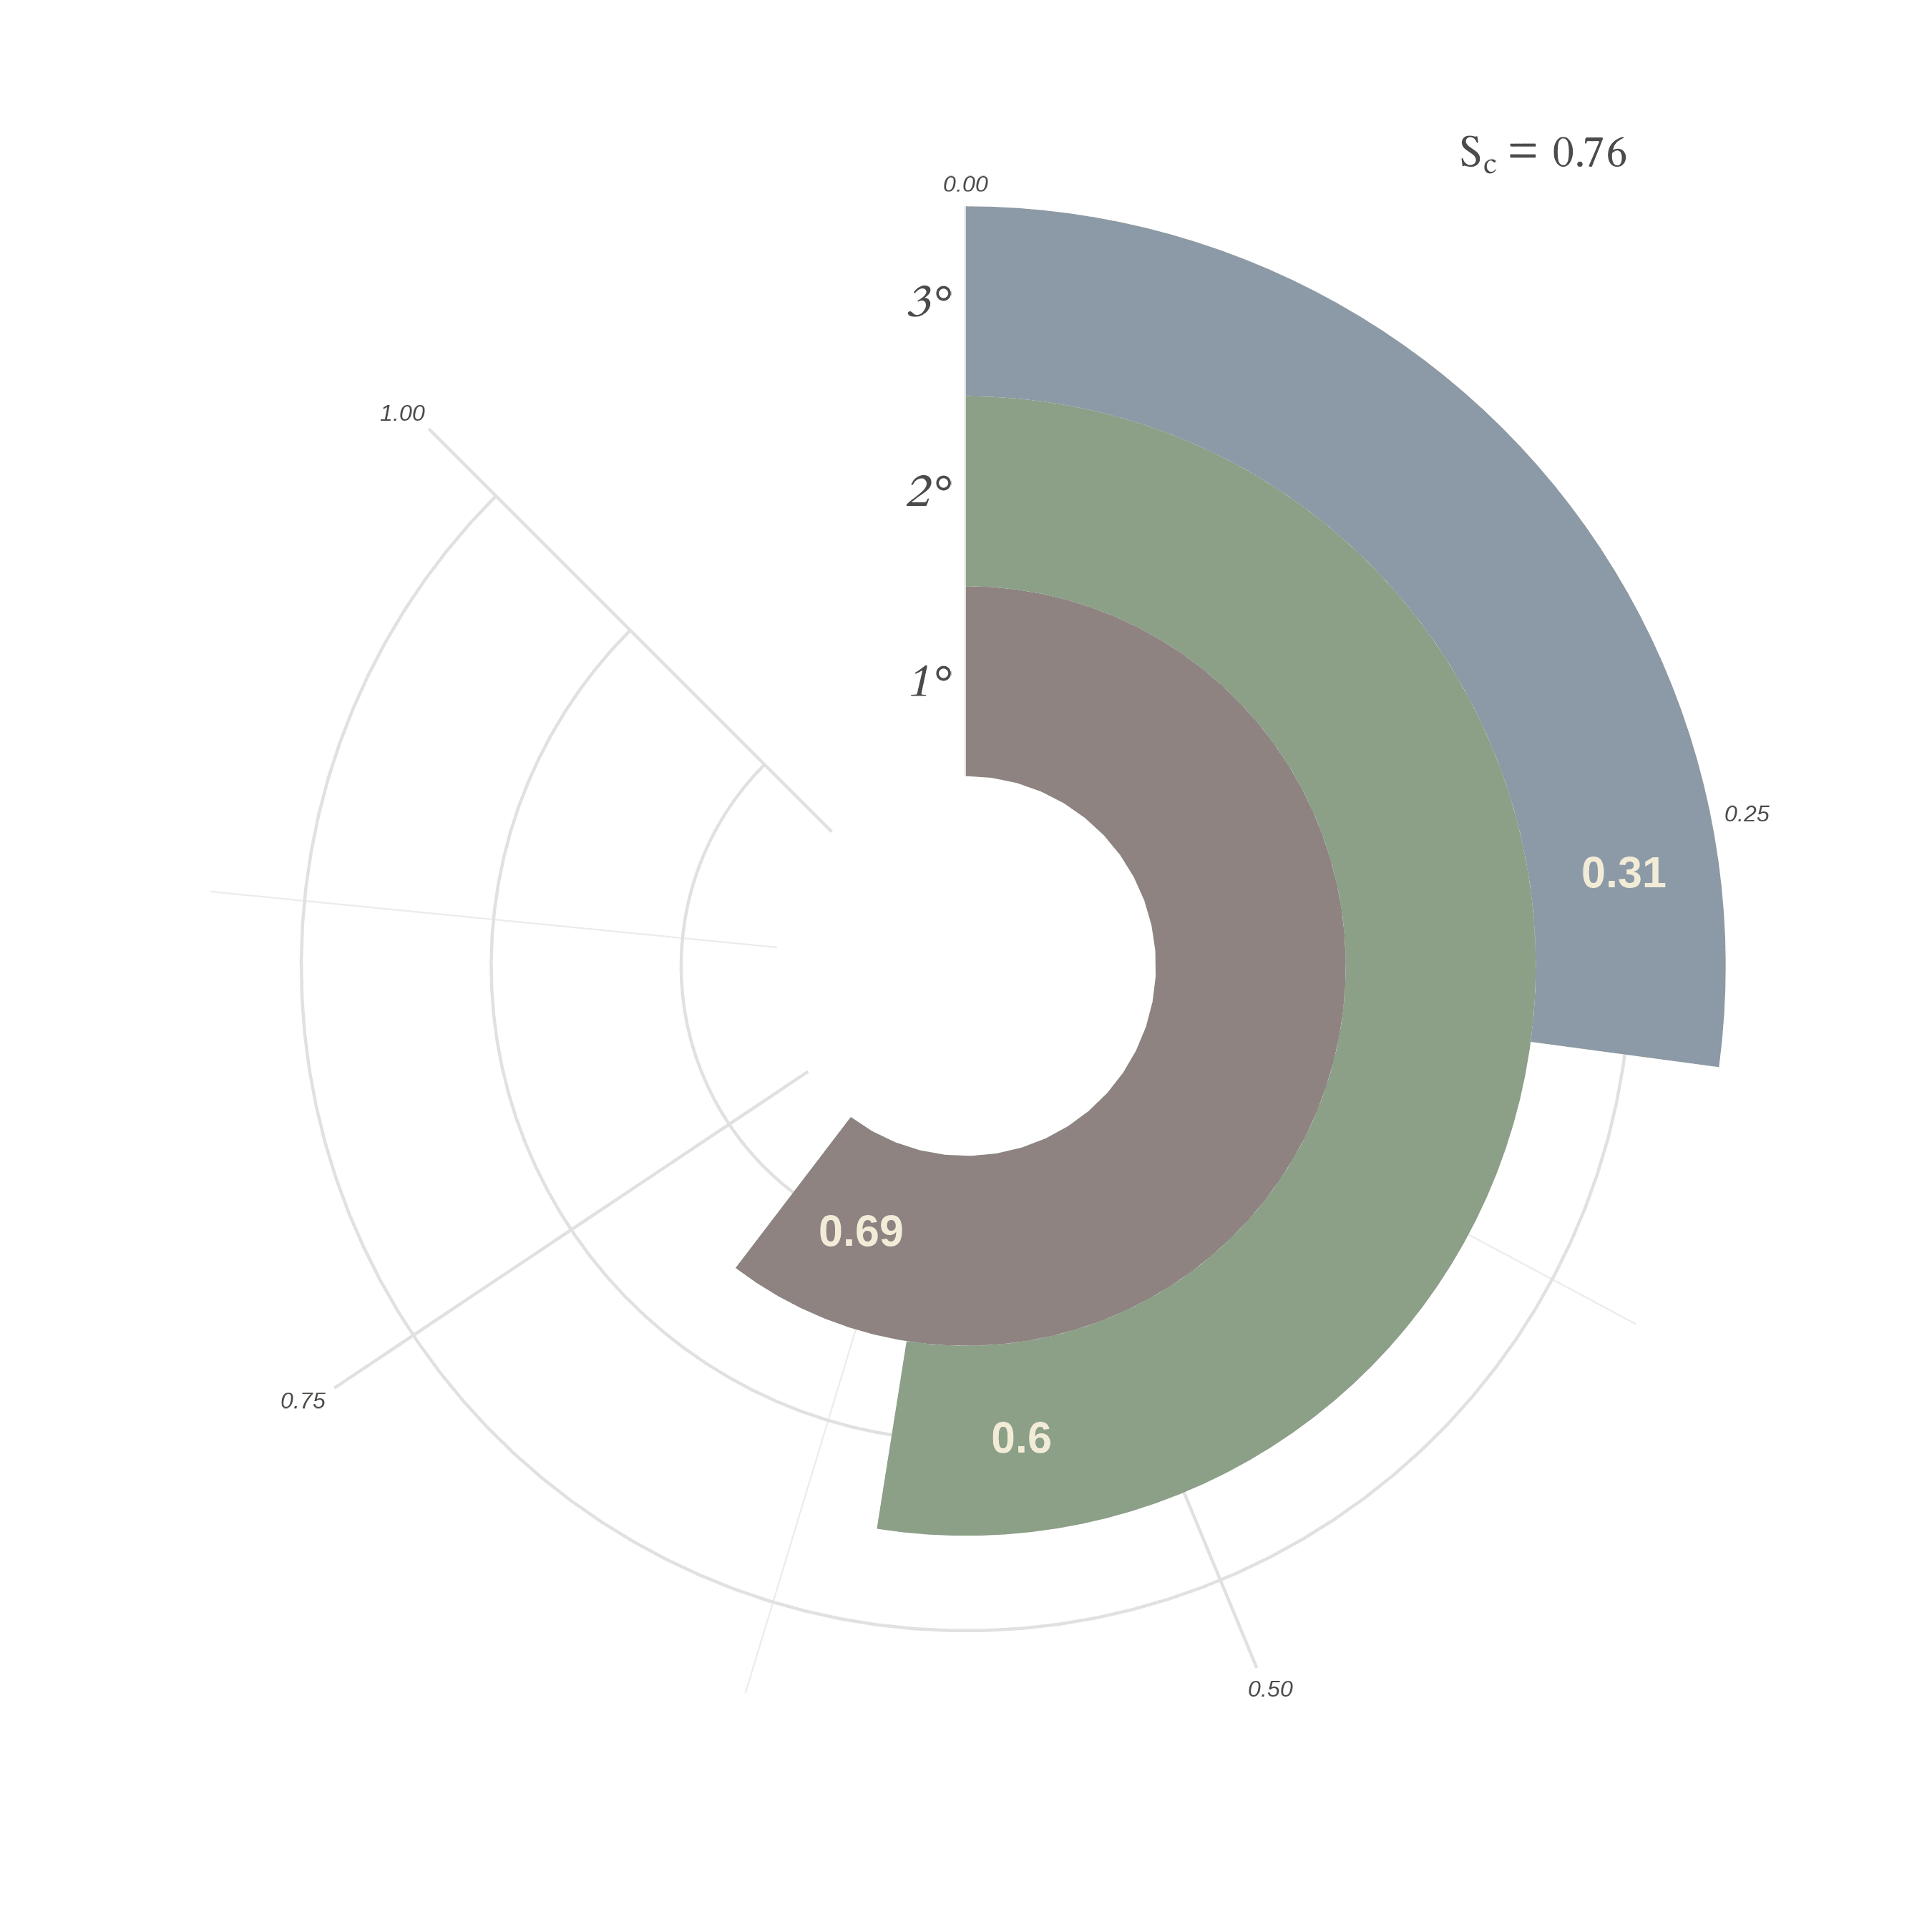
CEnTR*IMPACT addresses this through three integrated components, each answering a different question about the nature and significance of engaged scholarship. Together they form a complete picture, from the impact of a single project to the trajectory of an institution's engagement over time.

The system is grounded in a validated framework developed through collaborative consensus-building with faculty, community partners, and institutional stakeholders at Indiana University Indianapolis, and piloted across real community-engaged projects.

Read the foundational CUMU Collaboratory Fellowship Report →
Actively Used

Previously hidden work becomes visible. Community impact becomes legible.

  • 01

    Multi-dimensional impact scoring Combines alignment with community priorities, project dynamics, and cascade effects into a single comparable profile, without collapsing the complexity that makes the work meaningful.

  • 02

    Values-aligned measurement Intent matters as much as output. The CIP model weights genuine alignment with community priorities above raw activity, reflecting what practitioners know to be true about what makes engagement meaningful.

  • 03

    Publication-ready outputs Generates visualizations and narrative summaries suitable for P&T portfolios, grant reports, accreditation documentation, and institutional strategic planning.

  • 04

    Transparent rationale Every score comes with plain-language explanation, not a black box. Researchers and institutions can see exactly what the model is measuring and why.

The four score types

Sample outputs from Rising Waters, Resilient Communities. Click any card to enlarge.

Direct Indicators plot
SI Direct Indicators

Counts of quantifiable activities and outputs — engagement hours, individuals served, students involved — that provide essential contextual background.

Alignment Score plot
SA Alignment Score

Captures how much researchers and community partners agree on how the project is being carried out across eight factors, from Goals and Purposes to Community Empowerment.

Project Dynamics plot
SD Project Dynamics

Organized around the CBPR framework across five domains, it reveals how evenly distributed effort and cooperation are spread across the full arc of the project.

Cascade Effects plot
SC Cascade Effects

Draws on social network analysis to map and measure the potential for information and impact to spread, illuminating clear pathways and bottlenecks.

In Development

Not every contribution looks like a journal article. That's never been the problem. The problem is we've been using journal articles as the only unit of measure.

  • 01

    A common currency, not a conversion The SCE expresses contributions in a shared unit without forcing them into categories they don't fit. Community partnerships and journal articles can sit alongside each other, not ranked against each other.

  • 02

    Locally calibrated weights The Woutput term is where institutional values are encoded. Institutions can set weights that reflect their own priorities, and consulting with us helps make those choices explicit and defensible.

  • 03

    Relational labor recognized The sustained work of building and maintaining community partnerships — historically invisible in evaluation systems — becomes countable, comparable, and creditable.

In Development

A single project tells you what happened. A trajectory tells you who this institution is becoming.

  • 01

    Intent as the condition of possibility ℵ, the Intentionality Factor, scales the entire engagement snapshot. A project with high activity but low intentionality scores accordingly. Genuine purpose is not just one variable among equals.

  • 02

    Longitudinal, not just snapshots The CET tracks how an institution's engagement changes over time. revealing patterns, growth, and gaps that single-project evaluations cannot show.

  • 03

    Strategic planning support For administrators making the case for community engagement — to legislators, accreditors, and funders — the CET provides longitudinal evidence of institutional commitment, not just activity counts.

For Researchers

Document the full value of your community-engaged work, including the parts that don't fit a traditional CV. Generate evidence for P&T portfolios, grant reports, and public audiences that reflects what your work actually is.

For Institutions

Understand the landscape of engagement across your campus, calibrate evaluation systems to your institutional values, and produce the longitudinal evidence that demonstrates genuine commitment to community, not just compliance.

For Community Partners

Ensure that your contributions — your knowledge, relationships, and labor — are represented accurately and credited appropriately. The framework is built to center community assets, not institutional outputs.

Let's make the work visible, and the trust possible.

CEnTR*IMPACT works best when it's applied to your specific context. Let's talk about how the system can support your researchers, your institution, and your community partners.